The project team coordinated with MARC, KDOT, Leavenworth County, and the local jurisdictions to establish criteria for evaluating each project. Ultimately, for this planning effort, eight categories were identified associated with these criteria:
Traffic Operations / User Delay
Safety
Access to Amenities and Population
Economic Development / Jobs Access
Equity
Sustainability / Resiliency
Cost Effectiveness
Other Factors (e.g., Partnerships, Project Readiness)
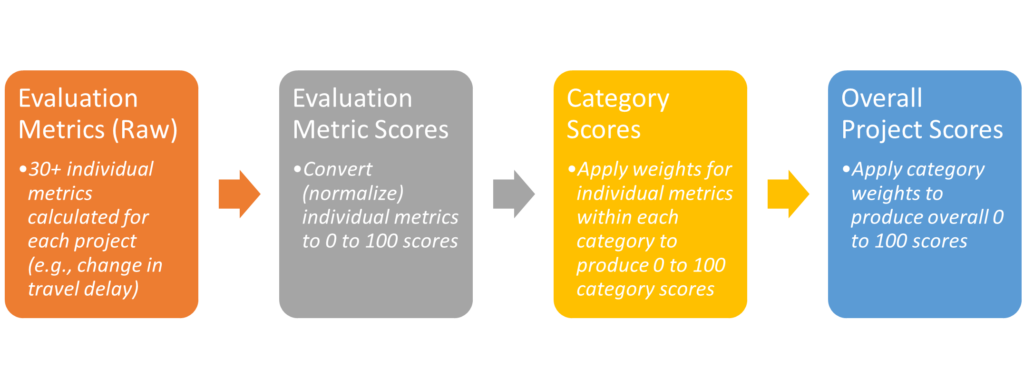
Within these categories, the project team developed a number of individual evaluation metrics that are described below. The following graphic shows how the individual evaluation metrics were scored, combined, and weighted to produce category scores and ultimately overall scores for each project.
Evaluation Categories and Individual Metrics
Traffic Operations and User Delay Category
Traffic Volume – future (2050) traffic volume in project area from MARC regional travel demand model; considers traffic volume on new facilities for projects that add new facilities to the network
Future Congestion – future (2050) maximum volume-to-capacity ratio from MARC travel demand model without the project in place
Travel Delay Reduction – projected change in average daily vehicle hours of delay with project in place (using MARC model); considers an influence area for each project to capture changes in delay associated with a new facility as well as nearby and parallel facilities that may also see changes in traffic volume and delay
Metric
Weight within Traffic Operations and User Delay Category
Traffic Volume
25%
Future Congestion
25%
Travel Delay Reduction
50%
Total
100%
Safety Category
Existing Crash History – number of crashes per year in project vicinity over the past six years (2016-2021) using crash data from KDOT; separate metrics were compiled for total crashes and fatal/injury crashes
Project Crash Reduction – projected reduction in crashes per year in project vicinity due to project using planning-level crash modification factors (CMFs) based on project descriptions; separate metrics were compiled for reduction in total crashes and reduction in fatal/injury crashes
Metric
Weight within Safety Category
Crash History – Total Crashes
5%
Crash History – Fatal and Injury Crashes
25%
Project Crash Reduction – Total Crashes
20%
Project Crash Reduction – Fatal & Injury Crashes
50%
Total
100%
Access to Population and Amenities Category
Access to Key Destinations – average increase in the number of key destinations (grocery stores, parks and public spaces, healthcare facilities, and community facilities such as schools, community centers, and post offices) within a 30-minute drive with project in place; metric is an average across all census block groups in the County
Access to Population – average increase in population reachable within a 30-minute drive with project in place; metric is an average across all census block groups in the County
Quality of Life – average increase in the number of key destinations within the County within a 15-minute drive; metric is an average across all census block groups in the County
Proximity to Schools – project is within ¼ mile of a school
Proximity to Parks and Recreation – project is within ¼ mile of a park or public space
Metric
Weight within Access to Population and Amenities Category
Access to Key Destinations
30%
Access to Population
40%
Quality of Life
10%
Proximity to Schools
10%
Proximity to Parks and Recreation
10%
Total
100%
Economic Development/Access to Jobs Category
Access to Jobs – average increase in the number of jobs within a 30-minute drive with project in place; metric is an average across all census block groups in the County
Access to Commercial/Industrial Development – average increase in the number of acres of commercial- or industrial-identified land use within the County within a 15-minute drive with project in place; considers future land use plans from each jurisdiction in the County; metric is an average across all census block groups in the County
Freight Access – increase in the number of census block groups within a 15-minute drive of an Interstate (I-70 or I-435) interchange with project in place
Land Development Access (new interchanges only) – number of acres of agricultural land within ½ mile of any new interchange project
Metric
Weight within Economic Development / Access to Jobs Category
Access to Jobs
30%
Access to Commercial/Industrial Development
30%
Freight Access
20%
Land Development Access (new interchanges only)
20%
Total
100%
Equity Category
Project located in Area of Persistent Poverty (APP), Historically Disadvantaged Community (HDC), or Opportunity Zone (OZ)
APPs and HDCs are defined by the USDOT for the RAISE grant program by the Bipartisan Infrastructure Law. Within Leavenworth County, APPs represent any census tract in which the poverty rate is at least 20 percent and HDCs represent additional qualifying census tracts identified by the Office of Management and Budget’s (OMB’s) Justice40 initiative.
OZs are low-income communities identified under the Tax Cuts and Jobs Act of 2017 with the intent of spurring economic growth and job creation while providing tax benefits to investors.
Within Leavenworth County, all APPs, HDCs, and OZs are located within the City of Leavenworth.
Access to Jobs (Equity) – average increase in the number of jobs within a 30-minute drive with project in place; metric is an average across census block groups in the County that are within an APP, HDC, or OZ.
Access to Key Destinations (Equity) – average increase in the number of key destinations within a 30-minute drive with project in place; metric is an average across census block groups in the County that are within an APP, HDC, or OZ.
Access to Population (Equity) – average increase in population within a 30-minute drive with project in place; metric is an average across census block groups in the County that are within an APP, HDC, or OZ.
Metric
Weight within Equity Category
Project Located in Area of Persistent Poverty
10%
Project Located in Historically Disadvantaged Community
10%
Project Located in Opportunity Zone
10%
Access to Jobs (APP/HDC/OZ Census Block Groups)
40%
Access to Key Destinations (APP/HDC/OZ Census Block Groups)
20%
Access to Population (APP/HDC/OZ Census Block Groups)
10%
Total
100%
Sustainability/Resiliency Category
Vehicle Miles Traveled (VMT) Reduction – projected change in average daily VMT with project in place (using MARC model); considers an influence area for each project to capture changes in VMT associated with a new facility as well as nearby and parallel facilities that may also see changes in VMT
Bridge Condition – project would replace a bridge currently rated in fair or poor condition according to the National Bridge Inventory
State of Good Repair – project would mitigate a low-water crossing or bring a gravel road to paved
Bike Route – project is located on a planned bike route in the County’s Comprehensive Plan or MARC’s Regional Trails and Bikeways Map
System Connectivity – project fills a bike/sidewalk system gap or provides a bicycle/pedestrian facility on non-residential streets
Metric
Weight within Sustainability/Resiliency Category
VMT Reduction
40%
Bridge Condition
15%
State of Good Repair
15%
Bike Route
15%
System Connectivity
15%
Total
100%
Cost Effectiveness Category
Benefit-Cost Index – a normalized (0 to 100) index using travel time savings and crash reduction benefits over 20 years, as compared to project capital and 20-year operations and maintenance (O&M) costs.
This is the only metric within this category, and as such is weighted at 100% for this category.
Other Metrics Category
Partnerships – to capture the potential for partnerships on project funding, this metric counts the number of jurisdictions crossed (city, county, state) for each project
Previous Planning History – this metric looks at a project’s status within MARC’s current Metropolitan Transportation Plan (MTP), such as whether the project is noted as “illustrative” or “financially constrained” or whether the project is not yet included in the MTP. It also examines whether the project is documented in a previous study or conceptual planning effort.
Projected Environmental Clearance Required – the projected environmental review process required; either Categorical Exclusion (CE), Environmental Assessment (EA), or Environmental Impact Statement (EIS)
Metric
Weight within Other Metrics Category
Partnerships
20%
Previous Planning History
20%
Projected Environmental Clearance Required
60%
Total
100%
Summary of Project Evaluation Categories and Metrics
Traffic Operations / User Delay
Safety
Access to Amenities and Population
Economic Development / Jobs Access
Equity
Sustainability / Resiliency
Cost Effectiveness
Other Factors
Traffic volume
Crash history (total)
Increase in key destinations in 30-min drive
Increase in jobs in 30-min drive
Project located in Area of Persistent Poverty, Historically Disadvantaged Community, or Opportunity Zone
Change in VMT due to project
Capital cost (including utilities, right-of-way, preliminary and construction engineering)
Partnerships (# of jurisdictions crossed)
Future congestion
Crash history (fatal / injury)
Increase in population in 30-min drive
Increase in acres of commercial / industrial in County in 15-min drive
Increase in jobs in 30-min drive for disadvantaged census areas
Project mitigates deteriorating bridge(s)
Operations and maintenance cost (20 years)
Previous Planning History
Travel delay reduction
Projected crash reduction (total)
Increase in quality-of-life destinations in County in 15-min drive
Increase in # of block groups within 15-min drive of I-70 or I-435
Increase in key destinations in 30-min drive for disadvantaged census areas
Project brings gravel roadway to paved
Cost Effectiveness (Benefit-Cost Index)
Projected environmental clearance required (CE / EA / EIS)
Projected crash reduction (fatal / injury)
Proximity to schools
Acres of agricultural (undeveloped) land within ½ mi of new interchanges
Increase in population in 30-min drive for disadvantaged census areas